
The goal of the HLA is to optimize science from the Hubble Space Telescope by:
The FAQ gives a detailed description of the types of data that are available in the HLA. Currently we have enhanced image products for ACS, WFPC2, WFC3, and NICMOS, extracted spectra from NICMOS and ACS grism observations, and source lists from ACS, WFPC2, and WFC3 images. Community-contributed high-level science products are also available.
The enhanced data products were generated from the standard HST pipeline products. The ACS, WFPC2, and WFC3, and NICMOS images have been combined using MultiDrizzle, are aligned north up, and, except for WFC3, have been astrometrically corrected when possible (for approximately 80% of the cases). The HLA-produced WFC3 images introduce an improved format described in the Image Formats FAQ. All HLA-produced images are in units of electrons/second, which for WFPC2 and NICMOS differs from calibration pipeline products; photometric zeropoints must be adjusted to reflect the units used.
Proprietary data and other data not yet processed by the HLA (including data from STIS, FOS and GHRS) are also accessible through the HLA, although with more limited functionality. These non-HLA data may be collected in the cart and submitted directly to the MAST/DADS interface for retrieval. Users can select proprietary, non-proprietary, or both types of data in the Advanced Search options.
Browser requirements: Currently the HLA interface is supported on
Firefox, Safari, Chrome, and Internet Explorer (versions 8* and 9).
To fully realize all of the HLA's functionality, one must have
cookies and popups enabled.
*IE8 limitations - the scatterplot and plotting tools do not work on IE8 as it does not support HTML5.
Type the name or coordinates of an object of interest into the "search box" at the top of the page and click on the Search button. If a name is used, the request is sent to the name resolver at NED (or to other services such as SIMBAD when necessary), which returns the coordinates and an image size that are used for the search. Some examples:
| M101 | Most objects have a default search radius from NED |
| M87 r=1.0d | You can explicitly change the default search radius |
| Antennae | The resolver recognizes many names |
| 14h03m12.6s +54d20m56.7s | If no radius is given a default of 0.2 degrees is used |
| 14 03 12.6 54 20 56.7 | Units are optional; equinox must be J2000 |
| 14:03.210 54:20.945 | Many formats are accepted |
| 180.468 -18.866 r=0.4 | Default units are degrees in this case |
| Virgo Cluster | The object can be quite extended |
| 0 0 r=180d | An all-sky search. Some restrictions exist. |
| I9ZF01010 | IPPPSSOOT name |
| 11563_52 | Proposal id and visit number |
There is an advanced search button to the right of the search box that reveals more options for selecting the data of interest, e.g., by specifying the instruments, proposal ID , spectral elements, moving target flag, and proprietary status. You can also select the desired data product level, including exposures (level 1), single-visit combined images (level 2), multi-visit deep images or mosaics (level 3), color images (level 4), or community-contributed high-level science products (level 5). The default best available level selects the data products that are generally the most useful (e.g., a combined image, if it exists, rather than the single exposures that were used to create that image). The Display options can be used to increase the size of the small preview images and to view image cutouts centered at the search position rather than the default full-field previews of the entire image.
Also available in the advanced search options is the Position List File Upload, which can be used to search at a list of target positions provided in a file. The RA/Dec columns in search lists can be in various formats, with a selection of column delimiters (whitespace, commas, tabs, etc.) and positions that are given either in decimal degrees or in sexagesimal format (hr min sec deg min sec). The image cutout option is especially useful with source lists. See the FAQ for more information and examples.
The tabs just below the search box provide three basic ways to view the results from the search:
INVENTORY (the default) - Shows the results in a table format. The Display link at the beginning of each row opens the interactive display for that image, while the FITS link adds the dataset to the cart for later retrieval. When FITS images are not available in the HLA, the cart link will be named DADS or TAR, depending on the data source, and the Interactive Display is replaced by a link to the MAST or ST-ECF preview page for the observation.
Proprietary datasets have links that are displayed in yellow (and preceded by an @ symbol) to alert the user that these data are not yet available to the public for download. They are however visible as footprints. Those who have access to proprietary data can add their data to the HLA cart and retrieve that data through MAST/STDADS.
Click on a table column heading to sort by that value (e.g., "ExpTime"). Clicking again on the same heading reverses the sort order. If there are more than 20 images found, there are controls to go through the table by pages or to jump to the first or last page. You can also change to 10, 50, or 100 results per page.
Brief definitions of the table columns are provided at the bottom of the page; you can also get tool tips by placing your cursor on the column heading. By default not all of the (many) table columns are displayed. See instructions on the bottom right to add, remove, or reposition columns. Note that if you customize the view, your settings are retained (as long as you use the same computer and web browser).
A subset of the inventory can be selected using the empty boxes under each column heading to filter out certain rows of the table (e.g., *HRC* will select only ACS/HRC images). Numerical columns support filtering using specific values, ranges, or limits (using > and <). Columns with character strings support exact matches or wildcard matches. An exclamation mark "!" at the start of the pattern indicates that only rows that do not match should be retained. Move the cursor over an empty box for instructions on the filter formats.
Table rows can be selected by clicking on them, and selected rows are highlighted. Clicking a selected row toggles the selection, so the row becomes unselected (and unhighlighted). Datasets can also be selected in the images and footprints views described below; datasets selected in any view are also selected and highlighted in the other views. The Add selection to cart button can be used to add the selected rows to the cart for downloading. Note that if the table has been filtered, only selected rows included in the filtering are added to the cart. The Reset selection button unselects all the selected rows.
The row selection can also be used for sorting and filtering the table. By default the selected rows are mixed in with the unselected rows, with the sort order determined by other parameters, but there are four possible choices:
When the selected data are shown first and the table is sorted by a column, each group of rows (selected and unselected) is sorted separately.
When rows are selected, they are highlighted but do not immediately move (e.g., to the top of the table when the selected rows are shown first). But when you move to a new page, the selected rows do get resorted and moved. So when selected rows are being shown first, you may notice that when you click a row, move forward a page, and then move back, the selected row has moved. This is even more noticeable when only selected or non-selected rows are shown; then rows may disappear altogether after paging forward and back. If you find this behavior disconcerting, you can use the default "Mixed" view, where whether a row is selected does not affect its position or visibility in the table.
Dataset selection is integrated across the Inventory, Images and Footprint views, so datasets selected in one view are highlighted in all views. The table shown in the Footprints view is now identical to that in the Inventory view and selections are treated consistently across all views.
IMAGES - Shows preview images of the search results, using the same sorting, filtering, selection, paging, etc. The Images and Inventory views always match, so the top row in the inventory table appears first on the corresponding images page. Each image is annotated with some of the relevant information from the inventory table, including the target name, instrument, filter, etc. There are also links to add the datasets to the cart and to bring up the interactive display. MAST previews are used for datasets without HLA enhanced products.
By default the images are full-frame previews reduced to a size of 256x256 pixels. The advanced search Display options allow increasing the size and changing to small image cutouts centered at the search position rather than full-field previews. Images for high-level science products include arrows indicating the directions of north and east; standard HLA image products have north up and east left and do not have arrows.
The Images view offers a few additional options for data access. The image can be downloaded either as a simple FITS file with only the science image data (named FITS-Science) or the full multiextension FITS file (named FITS-MEF) created by MultiDrizzle that contains the science image in extension [1], the weight array in extension [2], and the context image in extension [3]. When source lists are available, they can also be added to the cart. There are two types of source lists; DAOPHOT (primarily for point-like objects) and SExtractor (for both point-like and extended targets). There is also a plot link that pops up a window showing some properties of the catalogs.
The "More..." option in the bottom right provides access to a wide range of additional information, including a list of the exposures that went into the combined images, a link to the original HST proposal that collected the data, and links to the catalogs and to a large number of working files that are briefly described in the FAQ.
FOOTPRINTS - Footprints are the outlines of the region of the sky associated with each data product. In this view, footprints are shown overlaid on a Digitized Sky Survey (DSS) image, as well as listed in tabular form. Please note that the footprint view requires cookies to be enabled.
The footprint view was greatly expanded in functionality in DR5. The main window is fully interactive, and allows zooming and panning to view the outline of available data more clearly. To zoom in or out, click on the window and use the + and - keys. To pan, click and drag the desired location to the center of the window. The initial location and zoom level is selected on the basis of the requested search. The instrument list at the left of the main window lists the number of datasets available in the current search; the user can modify the instrument selection, but additional datasets become available only with a new search (click the Search button at the top of the screen).
The new footprint page also includes a full table of the datasets found; unlike previous versions, this table is fully integrated with other views, and selections made in each view are reflected in the others.
Besides the normal selection and filtering methods available in the Inventory view, the footprint page allows the user to select and deselect images graphically. Clicking on a position on the interactive window toggles the selection status of each image encompassing that location; selected images become highlighted in both the graphic window and in the table. (As in the Inventory view, if the table spans several pages the selected images may not be immediately visible, depending on the active option for "Show selected rows" at the top of the table.)
Note that the smallest instrument apertures (e.g., FOS, GHRS, ACS Grismor NICMOS Grism) may not be visible unless the image is fully zoomed in. The background DSS image is not particularly helpful for very small fields, but the ability to see how the HST observations relate to one another can still be helpful.
The footprint interface has an RA/Dec readout for the mouse position. Unfortunately, there is bug in the interface that makes the values wrong when the mouse is hovering over a footprint. The incorrect values are now hidden in the interface when the mouse is inside a footprint.
An important point to keep in mind when using footprints: While we try to make the footprints as complete as possible, they are not as complete as the HST duplication-checking tool. For example, the HLA does not include planned observations. Proposers must therefore still use the duplication tool to check for duplications.
CART - The HLA has a cart system to help simplify data retrieval. Any item in the HLA with a cart icon next to it can be added to the cart. This includes all files available for download. Note that in order for this to work, your web browser must have cookies enabled.
When items are added to the cart, the text on the cart tab will change to reflect what is in the cart. For files with known sizes, the total sum of the request size will be tallied as well as the total file count and dataset count for MAST-DADSitems.
Clicking the cart tab shows what is in the cart.
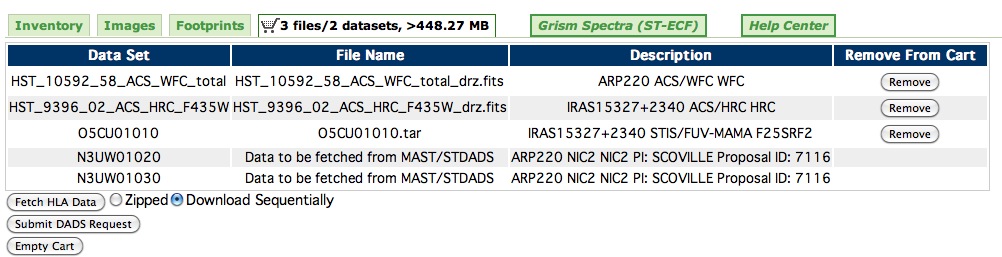
Items from the same HLA
dataset are grouped together into a single line for that data
group, with each file listed separately. For each group and
file, a button is present to allow you to remove a file or
group of files from the cart. For (non-HLA) products that
are to be retrieved using the
MAST/
STDADS
system, the files are be labeled as "To Be Retrieved from
MAST/
STDADS".
Below the cart are buttons to allow you to remove everything from the cart. If data in the cart are to be fetched from the HLA, a button labeled "Fetch HLA Data" will be found. Next to it are two radio button options, "Zipped", which will download all of the cart online files in one ZIP file, and "Download Sequentially" which will download each file one at a time. If data in the cart are to be retrieved from the MAST/ STDADS interface, a button with the text "Request DADS Data" will be found. Clicking this will popup a new window to allow the user to use the MAST/STDADS interface to retrieve all of this class of data found in the users cart in a single MAST/STDADS request. In the event that data are to be retrieved from both sources, both buttons will be present and must each be clicked.
Some notes on the "Download Sequentially" option. The behavior of this is browser specific. For
Internet Explorer, users have to click in a dialog box to save each file. Firefox, Chrome, and Safari allow the user
to set a default download directory in their preferences. Once downloads start, Safari simply downloads each file to that directory.
Chrome will download the first and then display this banner in the browser window asking if the user wants to
continue saving multiple files:

Saying Allow will let this session continue to download files until the browser is closed for the HLA site.
Firefox will ask a user what to do for each file unless the user tells Firefox to do this from now on for
this type of file.
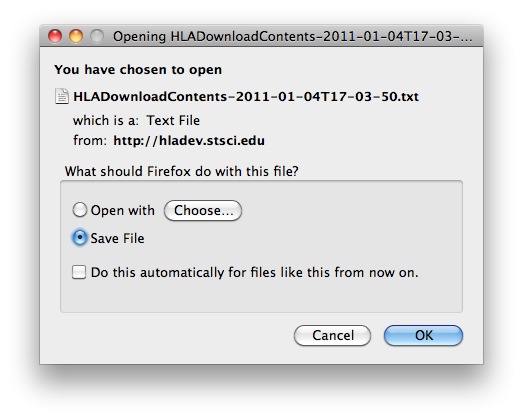
By checking "Do this automatically for files like this one from now on." and clicking OK, Firefox will continue to
save these files directly with no interaction required. Note this can be reversed in the Firefox preferences.
For the "Zipped" option, all downloaded files will be removed from the cart once the download is complete. For the "Download Sequentially" each file is removed from the cart once that download is complete. Hence if the browser crashes or is otherwise interrupted, all files not successfully downloaded will remain in the cart and can be fetched in a future session.
GRISM SPECTRA - Spectra for many sources in NICMOS and ACS GRISM observations have been provided by the Space Telescope-European Coordinating Facility (ST-ECF). These spectra have been extracted with uniform procedures and are available directly from the ST-ECF web page, which can be accessed through the Grism Spectra (ST-ECF) link just below the search box. They also appear in the HLA search results.
INTERACTIVE DISPLAY - You can look at an image or 2-dimensional spectrum more carefully, and overlay a source list or other catalogs (SDSS, 2MASS, GSC2, FIRST), by using the "interactive display" (via either the inventory or images view). The image can be moved by either using the arrows in the upper left (< > ^ v) or by dragging the image using the mouse. The o button recenters. The + and - buttons zoom in or out. The Lighter and Darker buttons change the contrast. The Invert button changes from white on black to black on white. SExtractor or DAOPHOT source lists from the image can be overlaid by clicking the appropriate box, as can SDSS, 2MASS, GSC2, FIRST, or GALEX catalogs (very useful to check the absolute astrometry). A readout in the upper left shows the x-y position of the cursor along with either RA/Dec or, for spectra, the wavelength and position along the slit. An interactive line or column plot can be made at the location of the cursor by typing "L" or "C". This is especially useful for spectra.
PLOTTING TOOLS - Two new plotting tools, released in DR7, make it possible to view spectral products at their full resolution, as well as plot the contents of source lists. The spectral plotting tool is invoked through the Display link in the Inventory or Images view, which is placed in the same location as the Interactive Display link for image products. (Load times can be long, 30 seconds or more, for spectra with tens of thousands of elements.) The plotting tool appears in a separate window, and by default shows the full wavelength range and the flux range encompassing 99.5% of the data. The user can change the scaling either interactively via the mouse, by dragging a box around the desired features, or by typing in the desired limits. Advanced functionality includes measuring line fluxes, smoothing, and determining the redshift given a rest wavelength. This plotting tool is also invoked when requesting a line or column plot through an image (from the Interactive Display); in this version, it allows coadding of multiple adjacent lines.
The catalog plotting tool is invoked from the PlotCat link in the Inventory view (by default in the second column). The link is only active for datasets with available source lists. The tool allows plotting of specified columns in either the Source Extractor or the DAOPhot catalogs, select data points in specified regions, and even make simple combinations of columns. Some of the options are accessed through the cogwheel at the bottom left of the plotting window. The catalog plotting tool has its own help file, which can be invoked from the link at the top right of the window.
SOURCE INFORMATION POPUP - A new functionality of the source overlay has been added in DR5, and extended in DR7 to the catalog plotting tool. Clicking on the position of one or more sources brings up a window with position and photometric information for each applicable source. This feature allows a quick verification of the properties of objects of interest, and can aid in the visual cross-identification of sources from different catalogs. A similar popup window with the properties of multiple sources - including the full list - can be invoked from the catalog plotting tool.
ADVANCED CONTRAST CONTROL - The advanced contrast controls allow finer control over the display than the Lighter/Darker buttons. The can be used to adjust the color balance by changing the contrast independently for each color and to adjust the bright/dark ends of the lookup table separately for color or grayscale images.
Another useful feature is that typing 'S' on the keyboard translates the current cursor position to RA/Dec and copies it into the search box on the HLA search form. You can use this in conjunction with the image cutout options to get quick previews from other HLA images at the same sky position.
See the Help in the upper right of the interactive display for more details.
SOURCE LISTS - Two types of source lists are available via the HLA: DAOphot, which is optimized for point-like objects, and SExtractor, which is optimized for extended objects. In both cases the detection image is a "white light image" (i.e., a combination of images using all available filters within a single visit, also referred to as the "detection"or "total" image). The source lists can be overlaid on an image using the interactive display, and can be downloaded via the Images view. The magnitudes are in the ABMAG system.
Please note that while the HLA images and source lists will be sufficient for many people's science, by necessity these products are developed for general usage rather than being "tuned" for a specific scientific goal. Hence in many cases the optimal science can be achieved by going back to the original STScI calibration pipeline data and processing on a chip-by-chip basis.
HUBBLE SOURCE CATALOG - The HLA source lists have been cross-matched and integrated into the Hubble Source Catalog (HSC). This catalog provides by far the easiest access to the source list information. It is available through Casjobs, the MAST portal, and other interfaces. The cross-matching makes this a valuable tool for catalog research.
One good reason to use the HLA source lists directly is to access them during the interval (typically a few months) between the time HLA source lists are released and the time when they have been processed to generate a new version of the HSC. Additionally, the DAOphot source lists are not currently integrated into the HSC (though that may change in the future), so research that depends on those also requires using the HLA source lists.
All-sky searching: All-sky (0 0 r=180) searches for all instruments are not available due to the large load both on our servers and your browser. You may choose one instrument at a time for an all-sky search. Unrestricted searches with multiple instruments are currently limited to search radii smaller than 10 degrees (which can still return very large search results). All-sky searches are allowed (1) if only a single instrument is checked in the Advanced Search options or (2) if the proposal ID, moving target flag, or specific spectral elements are specified.
Please note that some WFPC2 all-sky search results are so large that they exhaust your browser's memory. Therefore, we have restricted searches for WFPC2 all-sky, data product=All. WFPC2 all-sky, data product=Best (default) will most likely work, but may take a while. If your browser cannot handle that request, please refine your search (e.g., by limiting the search area or by selecting a specific product type, such as Level 4 to display only color composites). We are working on ways to mitigate this behavior. Also, we have found that Firefox handles these large requests better than Safari.
Constructing Images - HLA enhanced image products are projected onto a geometrically corrected, rectilinear grid and are oriented with North up. For each observation, the images have been grouped according to the filter in which they were obtained, and also according to which camera was used (e.g., observations carried out with ACS could be obtained with either the WFC, HRC or SBC camera).
Each set of images (grouped by filter and camera) is then processed through the HLA pipeline using the MultiDrizzle software (Koekemoer et al. 2002, HST Calibration Workshop, p.337 [PDF]) which corrects geometric distortion using the "drizzle" software (Fruchter & Hook 2002, PASP 114, 144), removes cosmic rays and combines the images. For the current release, the output pixel scale is set to be similar to the input pixel size, except for NIC3 and WFC3/IR:
| Detector | Pixel Size |
|---|---|
| ACS/WFC | 0.05" |
| ACS/HRC | 0.025" |
| ACS/SBC | 0.025" |
| WFPC2 | 0.10" |
| WFPC2-PC | 0.05" |
| NIC1 | 0.025" |
| NIC2 | 0.05" |
| NIC3 | 0.10" |
| WFC3/UVIS | 0.04" |
| WFC3/IR | 0.09" |
Smaller pixel scales were precluded primarily on the basis of diskspace limitations, but may be considered for a future release.
Each individual exposure, for all the filters used with a given camera, is first transformed separately to an undistorted output image. These (level 1) exposures are all registered to a common pixel grid (so that objects can be directly aligned on each image, even if dithering was used).
In addition, all the exposures for a given filter/camera combination are combined using MultiDrizzle into a final, clean (level 2) image for that filter/camera combination, which involves identification and removal of cosmic rays as well as astrometric alignment and distortion removal using "drizzle".
Finally, if more than one filter was used with a given camera during the observation, then the exposures from all these filters are combined into a single "total" (also called "detection" or "white-light") image, as long as two or more exposures were obtained in each filter so that the cosmic ray masks obtained separately from each filter can be used. These "total" images are included in the level 2 products and are shown as separate entries in the interface. They can potentially be significantly deeper than the images obtained in each filter separately, and are therefore used as detection images for the source lists. Images obtained with grisms or polarizer filters are excluded from the total image, although they are combined for each such spectral element separately.
The HLA provides access to its image data via a Virtual Observatory (VO)-compatible Simple Image Access (SIA) service. The VO SIA protocol allows retrieving image data from a variety of astronomical image repositories through a uniform interface. A query defining a region on the sky is used to select candidate images. The service returns a list of candidate images formatted as a VOTable. For each candidate image an access reference URL may be used to retrieve the image. Images may be returned in a variety of formats including FITS and various graphics formats.
To access the HLA SIA service, use the URL https://hla.stsci.edu/cgi-bin/hlaSIAP.cgi with a region expressed as the right ascension and declination of the field center and a search radius, both specified in decimal degrees. For example:
https://hla.stsci.edu/cgi-bin/hlaSIAP.cgi?POS=40.669,-0.013&SIZE=0.1
This query will return a VOTable of data that overlap the user input region. The client then can access each image via the URL field in the VOTable.
Note that the HLA SIA returns observations for which the actual sky coverage footprint of the observation overlaps the search circle. This differs from other SIA implementations, which usually return images with a reference position that falls within the search box. Specify SIZE=0 to retrieve data only for images that cover the specified RA/Dec point on the sky.
There are additional HLA-specific parameters that can be used to limit the list of data by instrument, processing level, etc. The standard SIA format=metadata query gives information on the other parameters. Parameters that are most likely to be useful include inst to specify a comma-separated list of instruments and format to specify data formats other than the standard FITS format. For example, to get a list of WFC3 observations that includes both HLA image products and DADS products (including proprietary data, for example), use this query:
https://hla.stsci.edu/cgi-bin/hlaSIAP.cgi?POS=210.802,54.349&SIZE=0.1&inst=WFC3&format=image/fits,application/tar,text/html
The regionSTCS field in the HLA results table (accessible in the Inventory view, though the column is hidden by default) is a description of the dataset's footprint region. The region is described using the STC/S Virtual Observatory standard, or Space-Time Coordinate (STC) metadata standard written as a string (/S). In this simple case, the string describes a polygon, with the coordinates of each vertex of the region (in degrees) listed in counterclockwise order. Regions in the results table use the FK5/J2000 reference frame by default, though STC allows others. Further, there is no time information included in the STC/S values as shown in the results table. The latest description of the entire STC standard, for string (/S) and XML (/X) formatting, is available at the IVOA website (https://ivoa.net/Documents/latest/STC.html).
- A paper entitled "The Hubble Legacy Archive: General Description and Validation of Products" will be available.
- An advanced search capability will allow you to select classes of objects (e.g., starbursts, irregulars, cepheids, ...).
All refereed publications based on data obtained from the HLA are requested to carry the following footnote:
Based on observations made with the NASA/ESA Hubble Space Telescope, and obtained from the Hubble Legacy Archive, which is a collaboration between the Space Telescope Science Institute (STScI/NASA), the Space Telescope European Coordinating Facility (ST-ECF/ESA) and the Canadian Astronomy Data Centre (CADC/NRC/CSA).
In addition, publications of research supported by an STScI grant must carry the following acknowledgment:
Support for Program number ____________ was provided by NASA through a grant from the Space Telescope Science Institute, which is operated by the Association of Universities for Research in Astronomy, Incorporated, under NASA contract NAS5-26555.