Close ×
2022 March 19: The HLA footprint viewer no longer works
because it relies on Flash. If you need footprints, we
recommend using the
MAST Portal.
Note that the Portal also gives access to the new
Hubble Advanced Products (HAP), which include more recent
observations.
The HLA contains no observations acquired after
2017 October 1.
Highlighted HLA Features:
- Find ACS Spectral GRISM Extractions for the Galaxy Cluster Abell 2218
Introduction
Advanced Camera for Surveys (ACS) GRISM data are slitless spectra acquired with the ACS grism mode. Rather than obtaining one spectrum at a time,
this observing mode makes it possible to obtain hundreds of specta in
a single observation. The Space Telescope - European Coordinating
Facility (ST-ECF) has created data products for the HLA by extracting
and calibrating the spectra of individual objects in the ACS and Near
Infrared Camera and Multi-Object Spectrometer (NICMOS) grism
observations.
This display can be reproduced in the HLA by using the following steps or clicking on the image above.
- Type hla.stsci.edu into your browser. Click on the "Enter Site here" button.
- Type "Abell 2218" in the search box and then press the "return/enter" key.
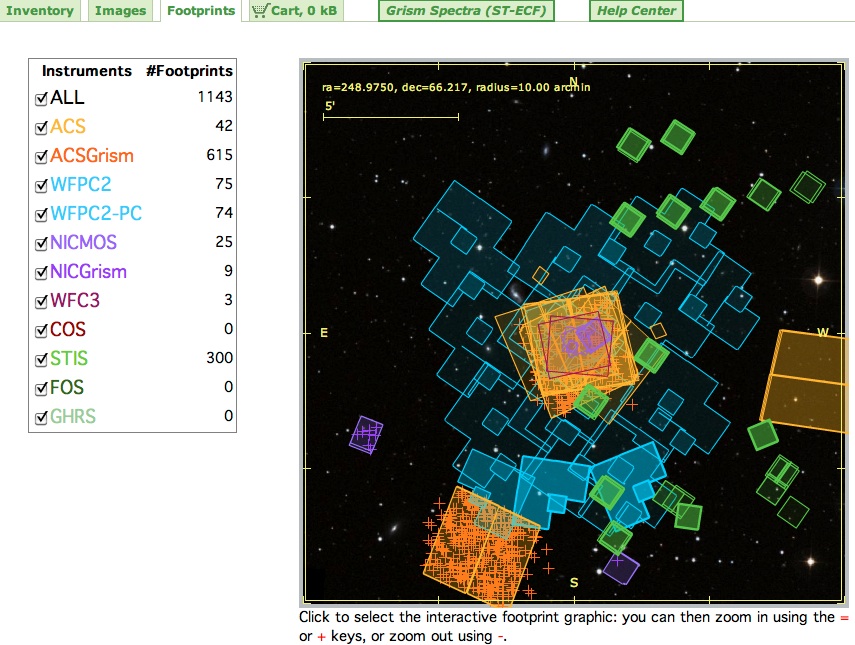
- Click the "Footprints" tab to view where HST observations of Abell 2218 have been taken for all the instruments.

- Scroll down the page to find the inventory at the bottom. Under the "Detector" column enter "*ACS/WFC*" (i.e., the ACS / Wide Field Camera) and under the "Level" column enter "4" (i.e., a color image). Press the "return/enter" key.
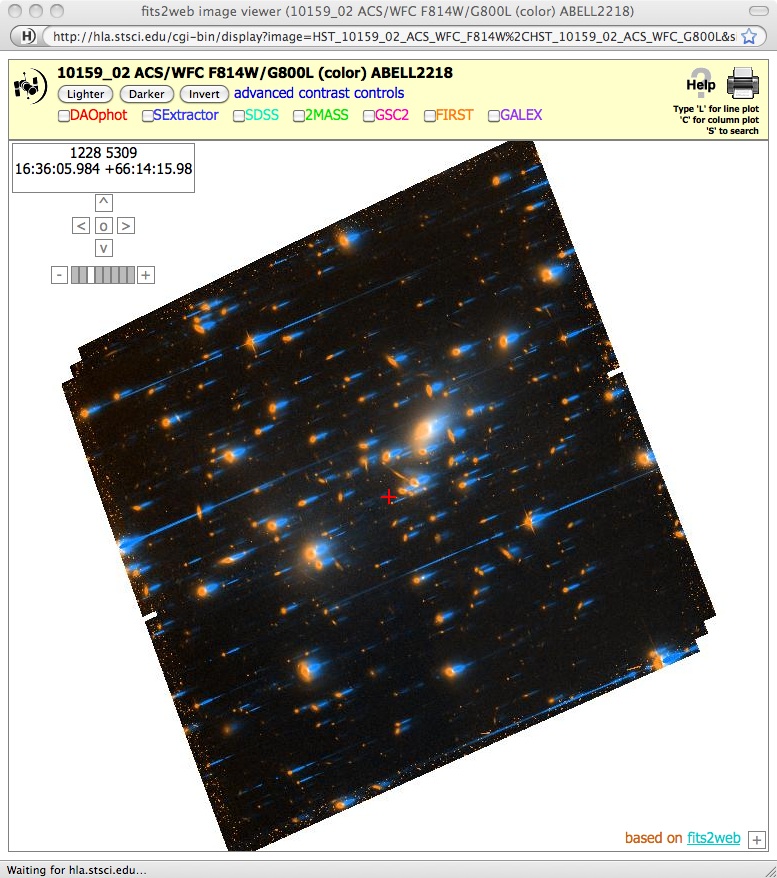
- Click on the "Images" tab. Locate the image "10159_01" (first image), which is the Abell 2218 color image
which uses the F814W (red = continuum image) and the G800L (blue = spectra) filters. Click on "Interactive Display". Zoom out by clicking the box with the minus sign in the upper left three times to make the image look like the image displayed at the beginning of this Image of the Month .
- Go back to the "Footprints" page and scroll down to the inventory again. Remove the "*ACS/WFC*" and the "4" from the boxes under the heading.
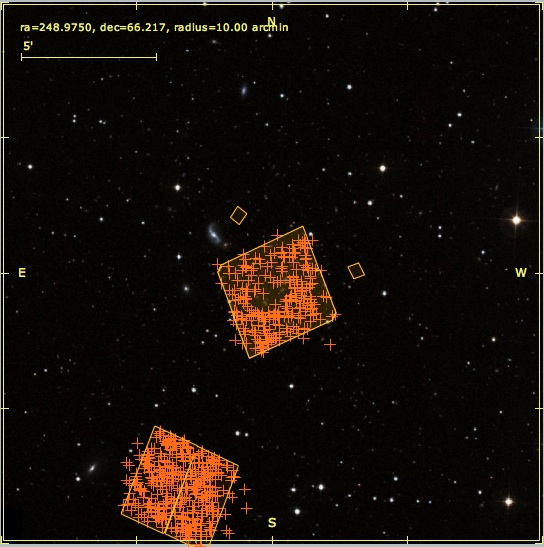
Enter "G800L" under the "Spectral_Elt" column and press the "return/enter" key. Scroll back up to view the "Footprints" display to show
the locations of the spectral extractions (the "X's").

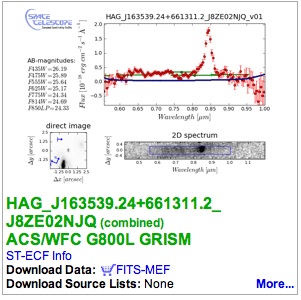
- Click the "Images" tab and examine the previews from each of the spectral extractions.
These show the continuum image, the 2-dimensional spectral extraction and box used for the extraction, a
plot of the spectrum, and AB-magnitude estimates of the source. The example shown below is the 9th extraction.

Additional Information:
To access the ST-ECF website directly, and learn more details about how the extractions where made,
click on the "Grism Spectra (ST-ECF)" tab.


