Close ×
2025 June 13: The HLA cart and HLA footprint viewer no longer work. Minimal
maintenance is being done on the HLA interface because all HLA
functionality and data products will soon be available in the new MAST
Hubble search interface.
At that point,
the HLA interface will
be retired. Note that the HLA products will still be available.
Click on data links to immediately download data.
If you need footprints, we recommend using the
MAST Portal.
Note that both the Portal and the new search interface also provide access to the
Hubble Advanced Products (HAP), which include HLA-style products for more recent
observations.
The HLA contains no observations acquired after 2017 October 1.
Highlighted HLA Features:
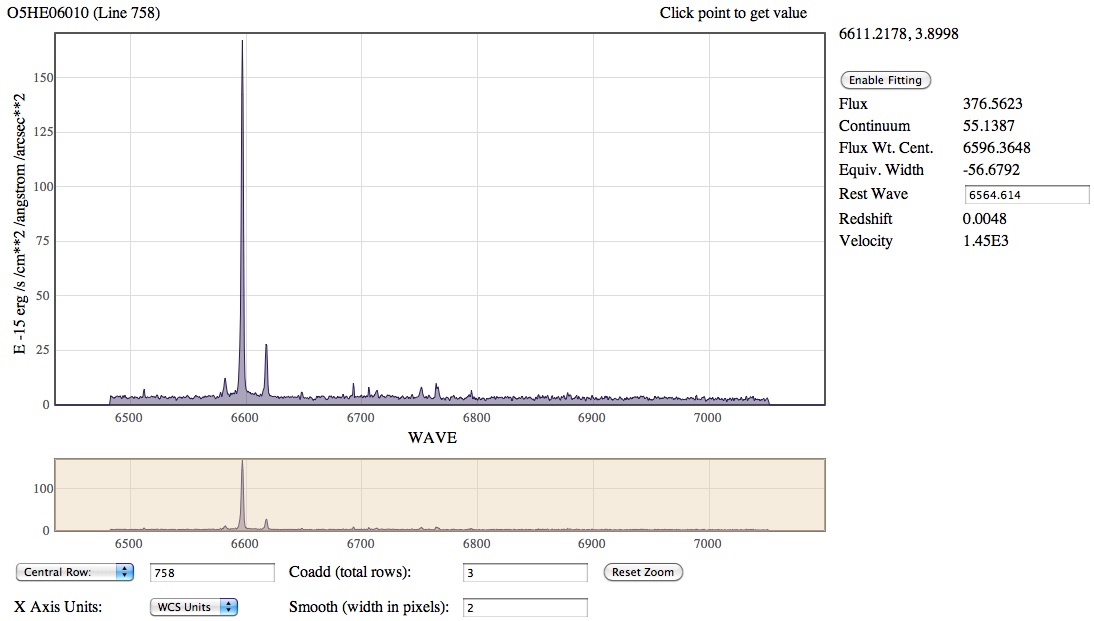
- Find and examine spectra.
- Use the line plotting tool to measure flux and wavelengths.
- Ability to determine the redshift and velocities with relative ease.
This display can be reproduced in the HLA by using the following steps.
Clicking on the image above will go directly to the spectral line plotting tool for O5HE06010.
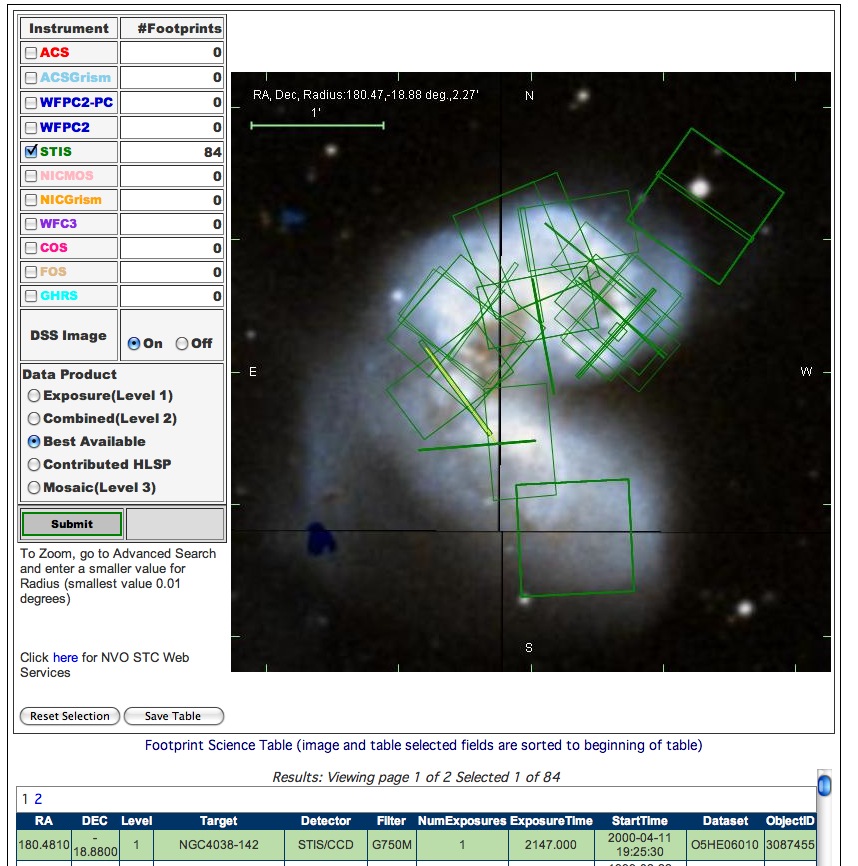
- Type hla.stsci.edu into your browser. Click on the "Enter Site here" button.
- Click on the "Advanced Search" link, which is to the right of the HLA Search Box.
- Uncheck the All Instruments Selection.
- Select STIS by checking its box, it's listed in the Standard Products section.
- Type "antennae" into the empty search box and hit the "return/enter" key or click on the "Search" button.
- Click the Images tab.
-
Scroll down and locate the NGC4038-142 STIS/CCD G750M 52X0.2 O5HE06010 image. It will be on the 2nd page. Click the
Interactive display
link.
- With your mouse in the Interactive Display on the top horizontal line, (i.e. the continuum spectra), type "L" to invoke the Spectral Line Plotting Tool.
- "Zoom in" on the Hα and NII lines (i.e., the three bright lines on the left) by drag selecting in the upper or lower region.
- Click on "Enable Fitting" then select the min/max points on either side of the Hα spike (i.e, the tallest spectral
emission feature) by clicking on both sides of the spike. The flux parameters will be calculated for your selected area.
- Enter the Hα wavelength, 6564.6 (in vacuum), into the Rest Wave text box. The redshift and velocity will be calculated.
- Smooth the spectra by using the Coadd (add several rows together) or Smooth (add several wavelength pixels together) features in the line plotting tool.
Additional Information:
Previous HLA Images of the Month