

|
News: Co-added direct and G800L FITS images available for download from the association table. ST-ECF ACS/WFC Grism Final ReleaseSummaryIn the continuing effort to enhance the content of the Hubble Legacy Archive (HLA) with highly processed data products which significantly facilitate the scientific exploitation of the Hubble data, the ST-ECF is pleased to deploy a full set of slitless spectra, obtained with ACS/WFC and the G800L grism, which were extracted from 153 archival fields (or "associations") distributed across the two Galactic caps (see Figure 1). This follows the full release of NICMOS grism spectra in 2008 (Freudling et al. 2008) and the ACS sample release (Kümmel et al. 2009c) in May 2009 of 1235 ACS spectra extracted from two NICMOS parallel pointings in the Chandra Deep Field South. This sample includes 47919 datasets for 32149 unique objects, superseeding the sample release. Each data set contains science-ready 1D and 2D spectra, as well as multi-band image cutouts of corresponding sources (see Figure 2 for examples), which were validated using an automated classification algorithm trained on the visual inspection of thousands of spectra. This quality control process leads to the selection 65% of the original 73581 spectra. The ACS G800L grism provides a wavelength range of 0.55-1.05 µm, with a dispersion of 40Å/pixel and a resolution of ~80Å for point-like sources.
For further information, please contact hla@stecf.org
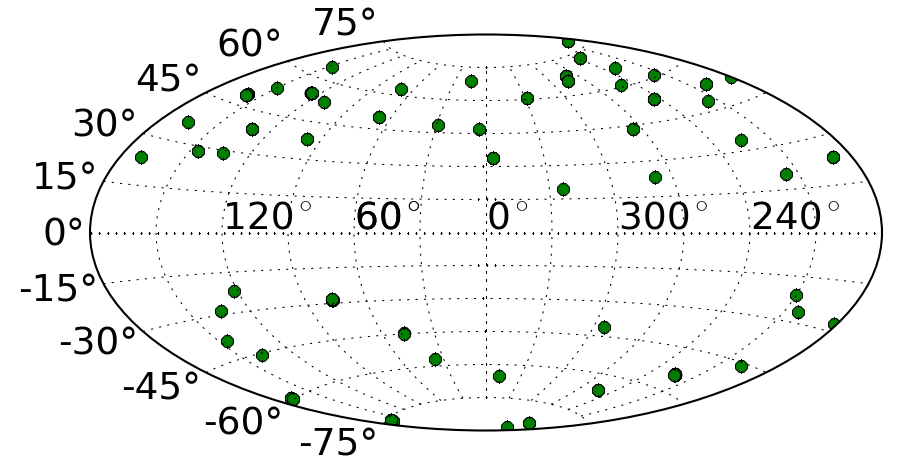
Figure 1: Distribution in Galactic coordinates of the 153 associations included in the release. Many associations are very close to each other and thus not discernible individually.
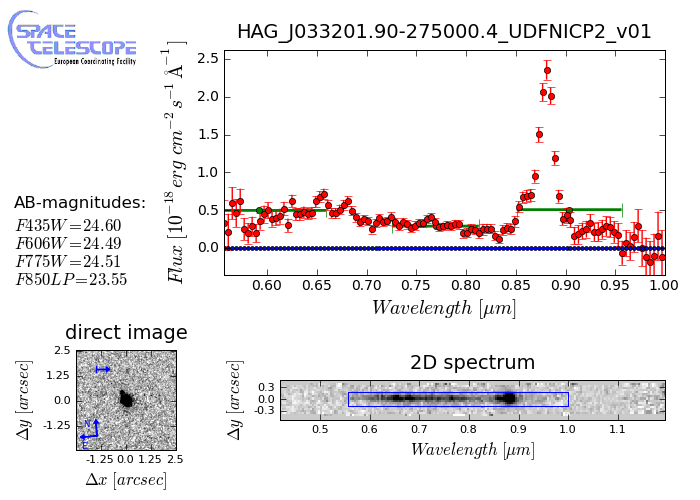
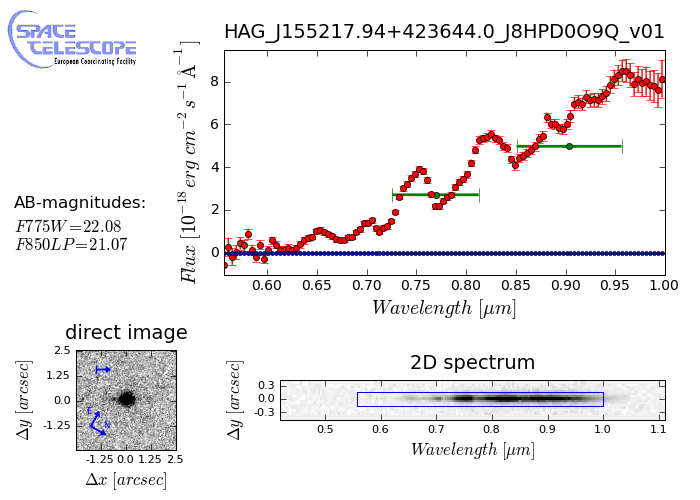
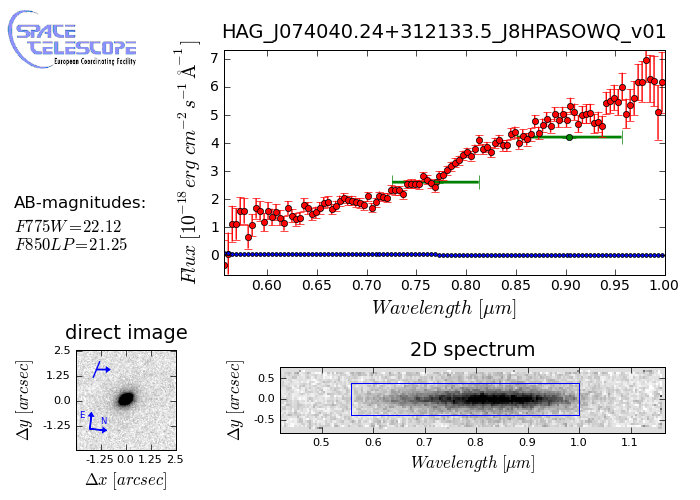
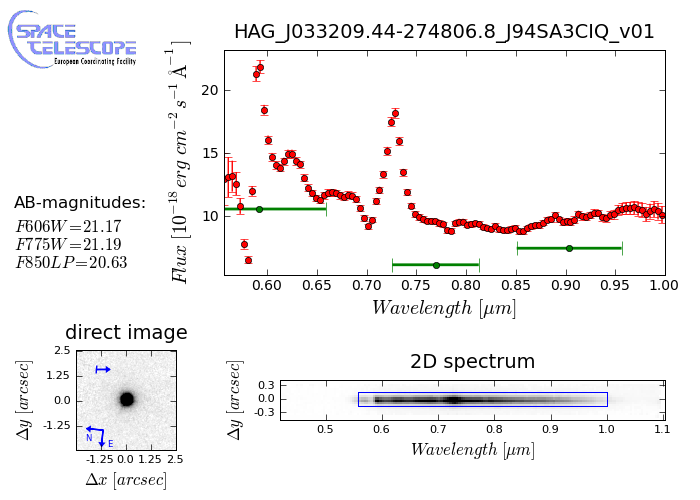
Figure 2: Examples of ACS grism spectra as shown in the previews included in the release. Blue curves (when present) indicate the estimated contamination from near-by sources as a function of wavelength. The green data points (horizontal bars) correspond to the integrated broad band magnitudes. The blue rectangular box in the 2D spectrum shows the effective extracted region where the optical extraction was performed. In the cutout direct image (all bands combined), the "pseudo-slit" and the dispersion direction are indicated (blue arrow). Top left: an M-star; top right:a low redshift star burst galaxy; bottom left: a broad-absorption line QSO identified as a Chandra X-ray source (Szokoly et al. 2004); bottom right: an early-type galaxy.
Maintained by Martin Kümmel <hla@eso.org> |

 |
 |