

|
Data release contentAll data products can be retrieved via the ST-ECF HLA archive interface or the STScI HLA portal which for each target return a cut-out of the direct (undispersed) image in all available filters, a 2-dimensional spectrum (position versus wavelength), and a flux calibrated 1-dimensional integrated spectrum of the target. All products are in VO-compatible FITS files with related metadata in FITS keywords. A visual summary of all data products is given in a preview page for each target also available from the archive (in png format, see Figure 1). The object names are formed as "HAG_hhmmss.ssddmmss.s_assoc_version" with "HAG" for Hubble ACS Grism, the association name "assoc" and the release version "version" (sample release: v01, this release: v01). Data Products FormatFor each source we release the the following products: The 1D spectrumThe 1-dimensional, integrated spectrum is stored as a fits table with the name ‹object name›.spec1d.fits. It contains the columns:
Please note that, as recommended by the IVOA Spectral Data Model, the values are stored as a vector in the first row of each column. The metadata is stored in the keywords of the fits file. Table 1 contains a description of all keywords. The 2D grism stamp imageThe 2D grism stamp images contains the combined pixel information from all input images. The 1D spectrum is extracted from the 2D grism stamp image. The multi-extension fits file is generated with the task axedrizzle and follows then naming scheme ‹object name›.spec2d.fits. It has the extensions:
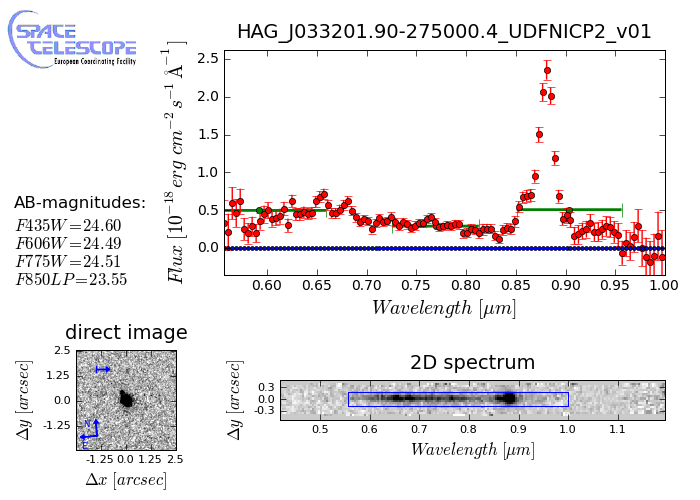
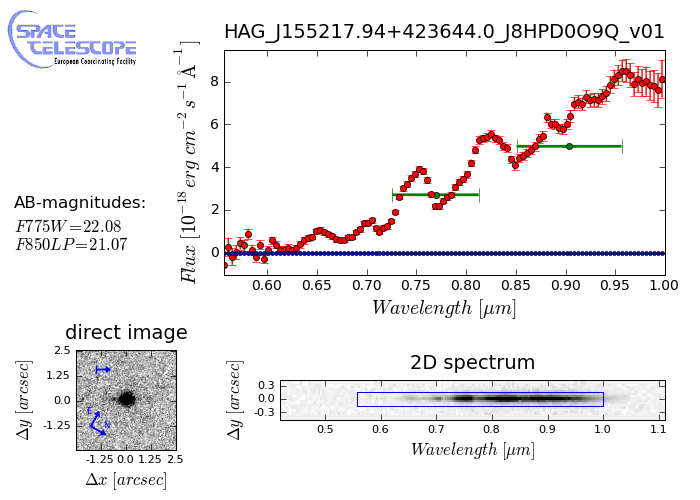
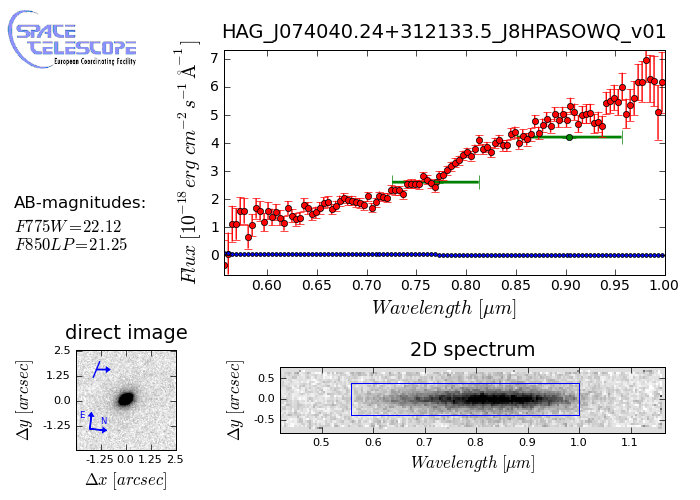
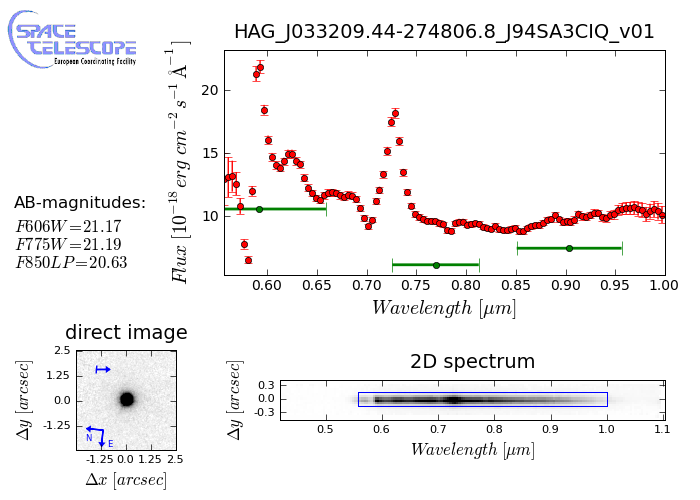
All extensions are equipped with WCS coordinates using the wavelength and the distances from the trace as first and second coordinate, respectively. In addition, the first (SCI) extension contains the metadata listed in Table 2 The direct image stampThe direct image stamp contains cutout images and corresponding weight images from all available direct imaging. The first two extensions contain the cutous from the detection image and the associated weight image. In associations that have direct imaging in several filters, the detection image was co-added from the combined filter images, and the first two extensions are named "SCI_WHITE" and "WHT_WHITE". The following extensions are then the combined filter image and the associated weight image, named as "SCI_‹filter name›" and "WHT_‹filter name›", for each filter. All extensions contain WCS information. The direct image stamps are named as ‹object name›.drizzle.fits. The metadata of the zeroth extension of the direct image stamp are listed in Table 3, and the metadata of the higher extensions are listed in Table 4. The preview imageThe preview image below give examples of all data available for an object. It contains a spectrum plot with the contamination estimate (blue curves) and bars (green) corresponding to the integrated broad band magnitudes. In the image of the 2D grism stamp, the blue rectangular box shows the effective region where the extraction was performed. The direct image contains (blue) arrows, one indicating the orientation on the sky , the other showing the dispersion, the extraction direction and width. The preview images also contain the direct imaging magnitudes in all available filters and are named as ‹object name›.preview.png.
Figure 1: Examples of preview images for ACS grism spectra in the release.
Maintained by Martin Kümmel <hla@eso.org> |

 |
 |